
TOPIC 3: WAVES
Sound waves travel through air, water and any other solid, liquid or gas. However, they cannot travel in a vacuum, because they need molecules or atoms to pass on the vibrations.
When a sound is made, for example by a loudspeaker, air molecules are pushed forward by the speaker cone, and this makes a pressure wave in the air. Where the molecules are closer together, there is a high-pressure region (called a compression) and where they are more spaced out, the pressure is lower. (A 'rarefaction'). This is shown in figure 1:
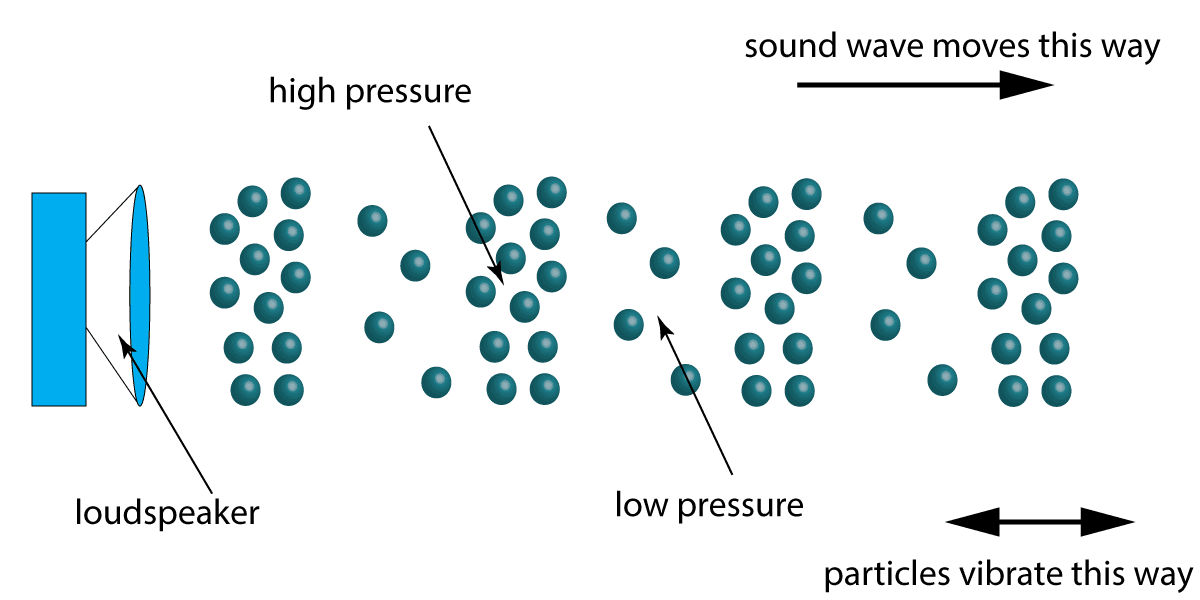
Figure 1. A sound wave moving through air
The particles move backwards and forwards, left to right, whilst the sound pressure wave moves to the right in this diagram. This means that sound is a longitudinal wave, as the particles vibrate parallel to the direction of the wave motion. (See section 3.1).
Here's an excellent animation showing air particles creating the wave motion:

Figure 2. A Longitudinal wave (L. Perera)
Humans can hear a wide range of frequencies. The lowest sounds that we can detect are about 20 Hz. The highest sounds for a healthy young adult are about 20 000 Hz or 20 kHz. As we get older, our range of hearing decreases, particularly with the high frequency sounds.
This YouTube clip sweeps through the whole human hearing range. Put some headphones on or play this through some good loudspeakers. Can you hear to the end of the clip right up to 20 000 Hz?
Youtube - The range of human hearing - 20 Hz to 20 000 Hz -test
(Sonic Electronix)
If you could not hear the end of this clip, it may be that your sound system cannot play sounds that high, rather than your hearing is defective! However, listening to loud music for a long time can eventually damage your hearing and reduce your range and sensitivity to sounds. Try playing this clip through your laptop or phone speaker to find out how limited the range is - this is why music does not sound so great through the speaker in a phone or laptop.
As you may well be aware, some animals like dogs and cats can hear much higher frequencies than humans, well above 20 000 Hz. Elephants and some other large animals can hear sounds below 20 Hz.
When listening to music, if we hear a very high musical note, we say it has a high pitch. This means that the loudspeaker or headphones that made it are vibrating extremely quickly - at a very high frequency.
A loud sound is made when the amplitude of the vibrations is very large, and conversely quiet sound waves have a small amplitude. It is important to understand this so that when people describe sounds using every-day terms like pitch and loudness, we can relate the description to physical measurements.
Sound waves are invisible. We cannot see them moving through the air. However, we can convert sounds to an electrical signal using a microphone. The electrical signal can then be displayed on a device called an oscilloscope. An oscilloscope looks similar to a heart rate monitor used in hospitals - a small dot moves left to right across the screen, and any change in the signal moves the dot upwards or downwards. To display sound waves, the dot moves so quickly that it looks like a continuous line to us. We will learn more about using the oscilloscope later in this section.
The 'height' of a wave from the centre line is called the amplitude, and this gives us a measure of the loudness of the sound. If the waves are close together, then the wavelength is short and the frequency is high - it will sound high pitched.
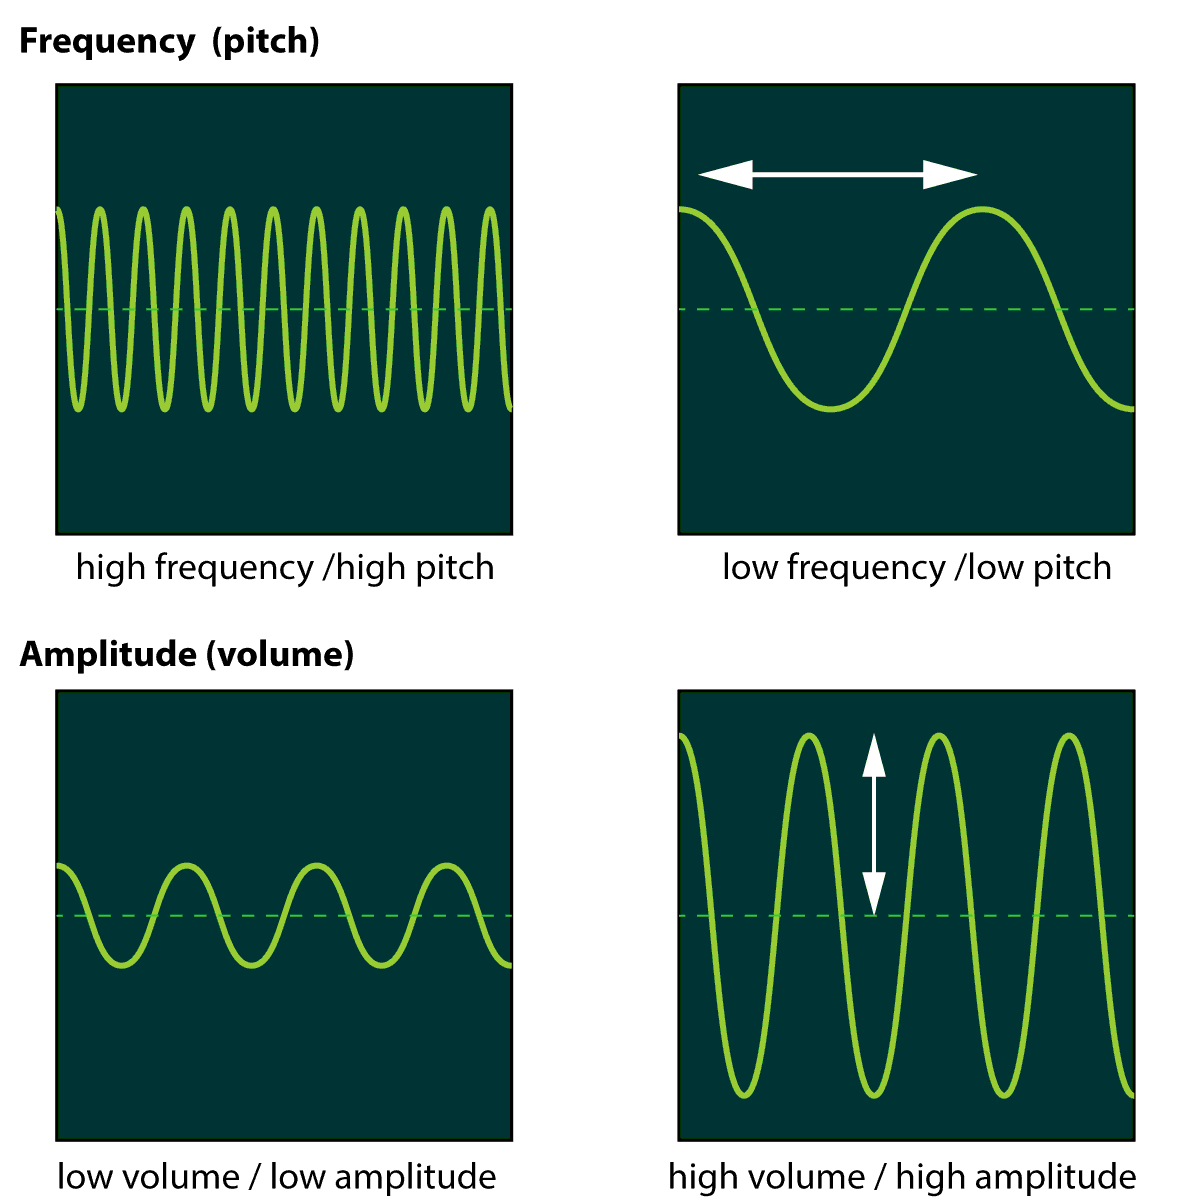
Figure 3. Sound waves displayed on an oscilloscope
Questions:
1. The diagram here shows a wave displayed on an oscilloscope screen.
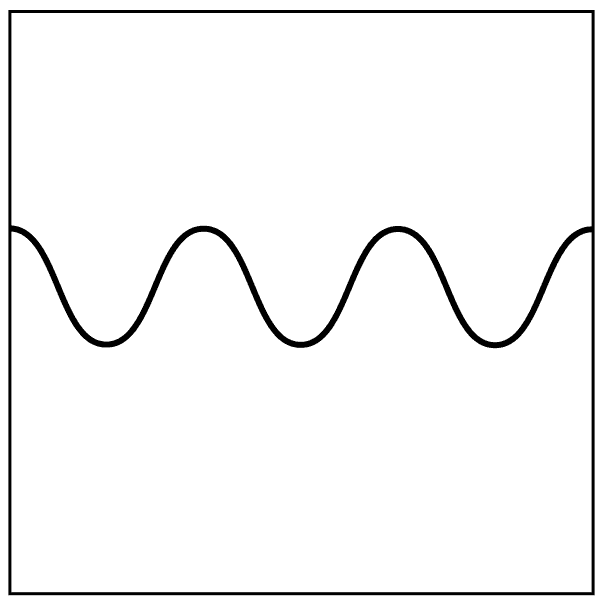
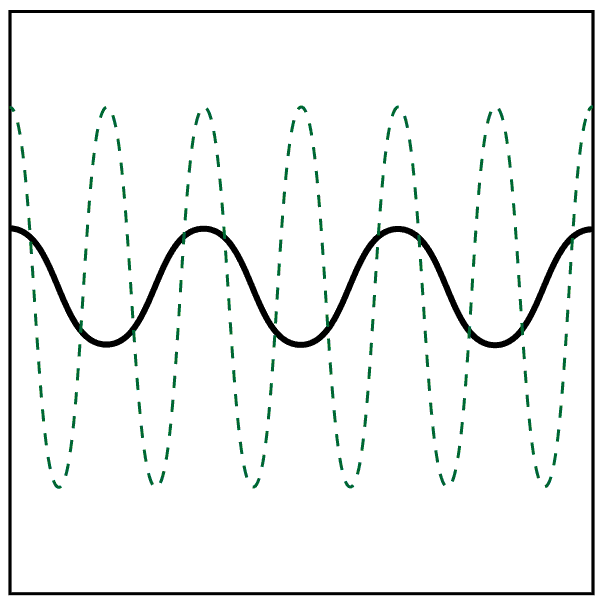
Add a second wave on the diagram to show a wave with a higher pitch and louder than the original sound.
The wave drawn should be:
An example is shown here as a dotted line:
A standard laboratory oscilloscope is a difficult device to operate with a large number of controls. Figure 4 shows a simplified diagram showing the two key controls we need:
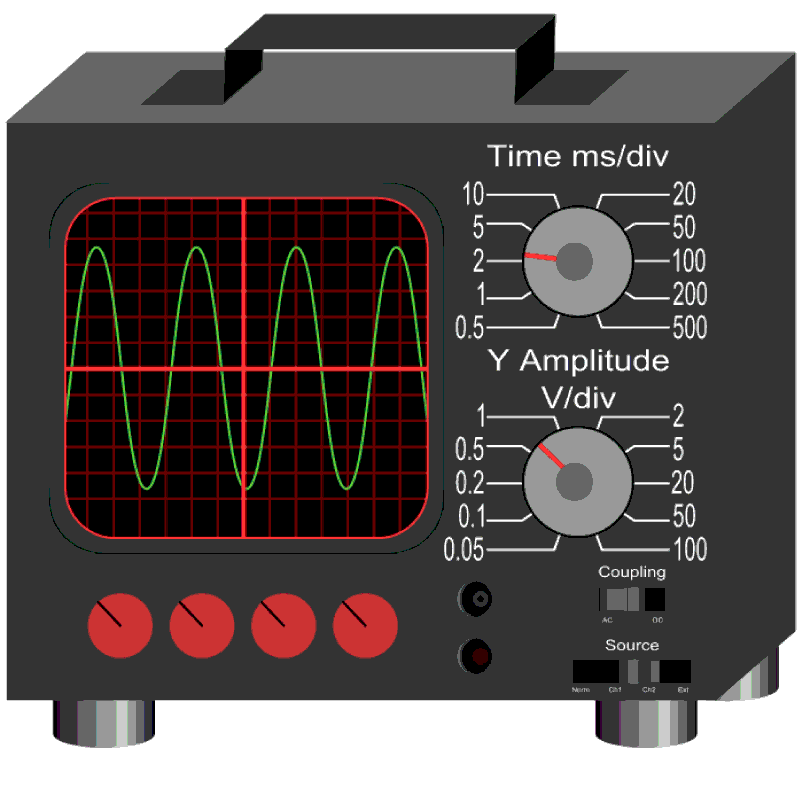
Figure 4. An oscilloscope - simplified diagram
(Theresa Knott / Severino666 - CC by SA 3.0)
For this practical, you should be able to describe how to use an oscilloscope to take readings from the screen.
The best way to understand how to use an oscilloscope is to try one out, preferably in a lesson. However, there are some nice on-line simulations. Try this excellent one - click the image to take you to an external website by academo.org where you can try out the controls and see what they do. You can use your computer microphone as the input to investigate sound waves, or chose a 'sine wave' from the simulation using the input selector shown.
Website link - Virtual Oscilloscope - by Academo.org
The two key controls you should be able to use and explain are:
On the screen shown above, the wave shown has a wavelength of 4 divisions. Using the controls on the right, we can see that the oscilloscope controls have been set at '1 ms / div'. This means 1 millisecond per division. Therefore the time period for a single wave is 4 ms or 4 x 10⁻³ seconds.
Finally, we know that:
| ƒ = | 1 |
| T |
So:
| ƒ = | 1 | = 250 Hz |
| 4 x 10⁻³ |
This section of the syllabus can be difficult if you do not have experience with oscilloscopes. The best way to practise measuring a wave with an oscilloscope is to look at a few examples:
Questions:
2. The diagram shows a wave displayed on an oscilloscope, set to 2 V /div on the y-axis and 5 ms/div on the x-axis:
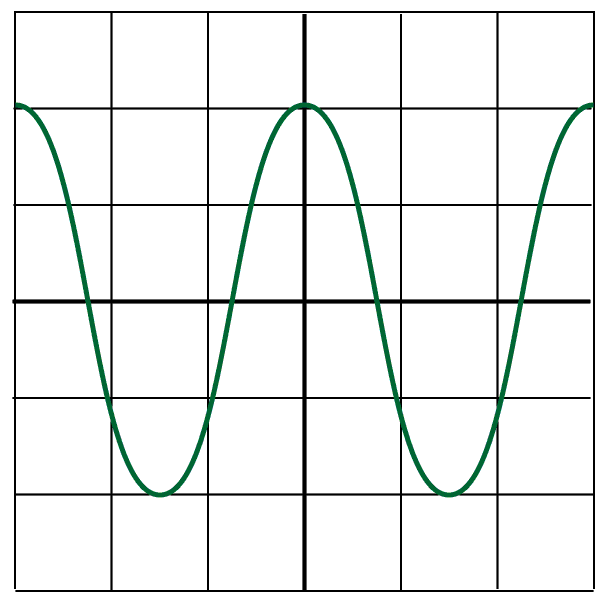
a) The amplitude is the height of the wave from the centre line. This is 2 small squares, or divisions. As the oscilloscope is set on 2 V/div, then 2 divisions represent an amplitude of 4V.
b) The time period is shown by the x-axis. The distance from one peak to another is 3 divisions on the screen. Each division represents a time of 5 ms, so 3 divisions gives a time period of 15 ms.
c) 15 milliseconds is equal to 0.015 seconds. We know from the wave formula section 3.2 that:
| ƒ = | 1 |
| T |
So:
| ƒ = | 1 |
| 0.015 |
3. A dolphin is producing a sound under water. An underwater microphone is used to display the sound on an oscilloscope screen, as shown here:
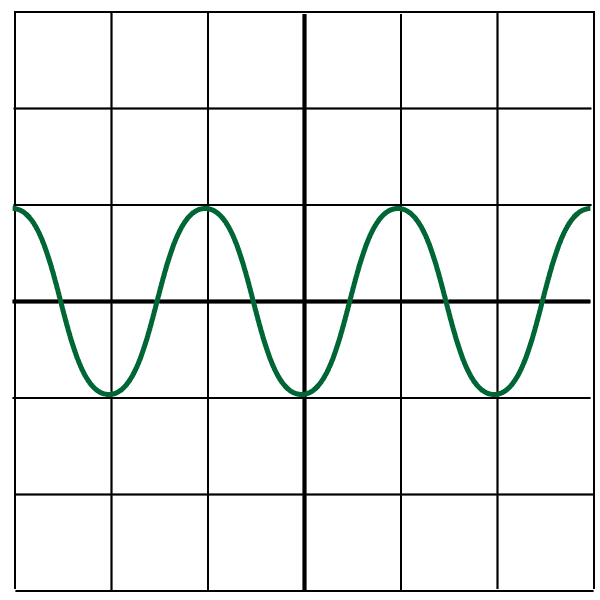
The oscilloscope settings are at 0.1 V /div on the y-axis and 0.01 ms / div on the x-axis.
a) The peaks of the wave are 2 divisions apart, and each division represents 0.01 ms. Therefore the time period is 0.02 ms. In seconds this is 0.00002 s, and in standard form this is 2 x 10⁻⁵ s.
| ƒ = | 1 |
| T |
So:
| ƒ = | 1 |
| 2 x 10⁻⁵ |
ƒ = 50 000 Hz (or 50 kHz)
b) The range of human hearing is from 20 Hz to 20 000 Hz.
c) The answer from part (a), 50 kHz, is higher than the range of hearing, so cannot be heard. Note that the diver can hear other lower frequency sounds under water.
To find the speed of any object, we need to find the time it takes to cover a specific distance. We can use this principle with sound. For this course, you will need to be able to describe an experiment to measure the speed of sound. There are many methods available, but this one is simple to perform if you have a nearby building next to open ground:
You will need:
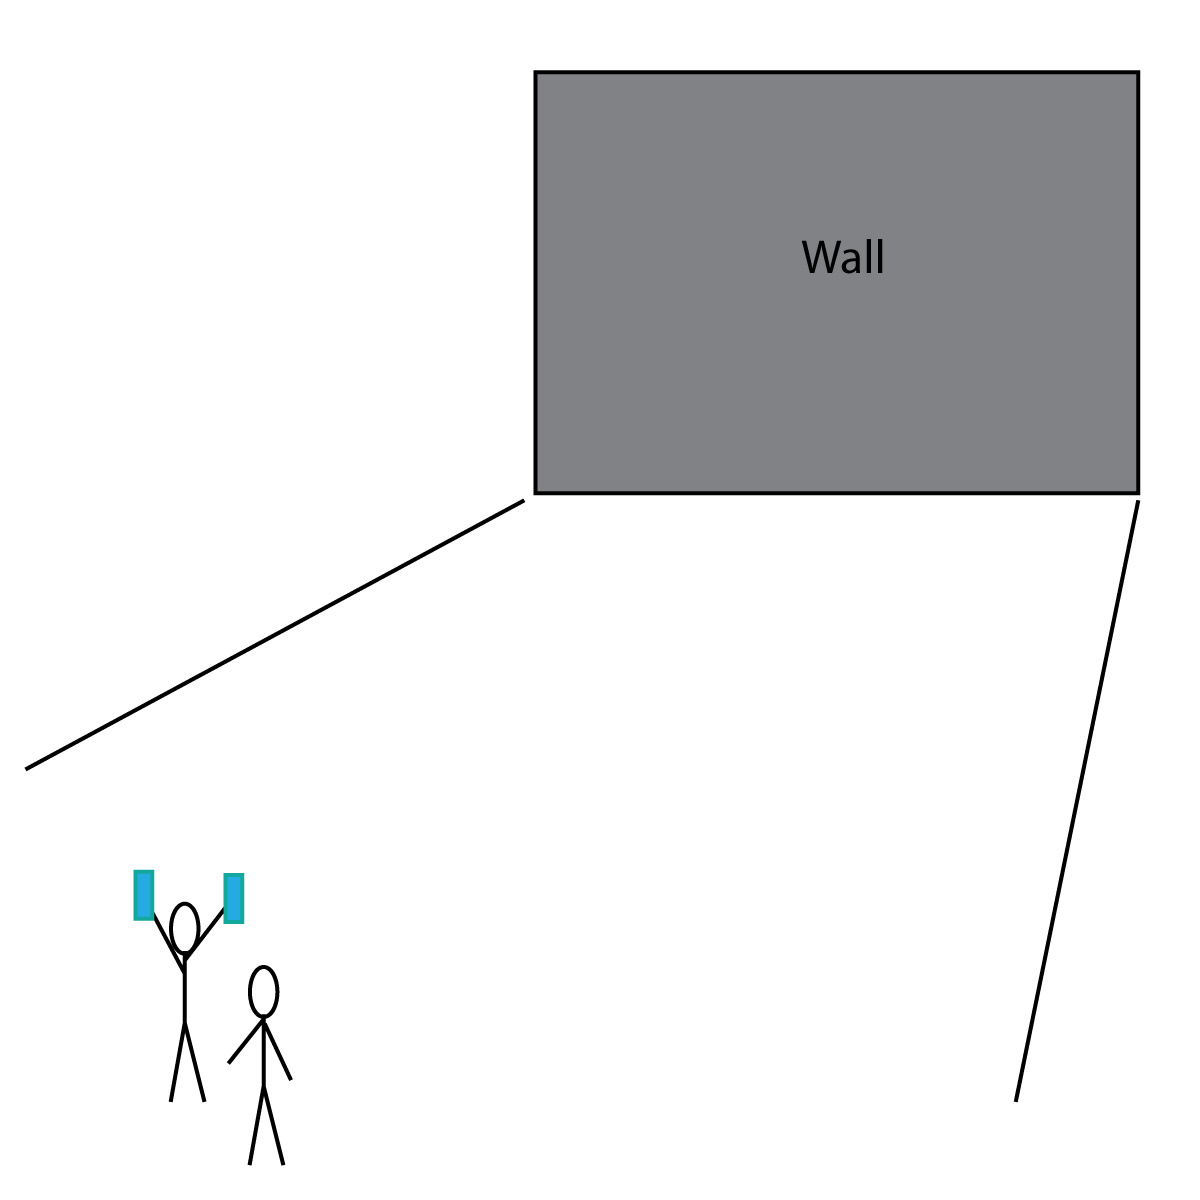
Figure 5. Measuring the speed of sound
To perform this experiment, simply bang the two wooden blocks together at the same time as a partner starts a stop watch. You will hear an echo from the wall - stop the stop watch as soon as you hear the echo. (An echo is a reflection of the sound from the wall).
Do this several times to get an average - it can be difficult to measure this accurately. If you have the distance to the wall, and the time it took for the echo to return to you, then we can use:
| speed = | distance |
| time |
This will give us the speed of sound. Remember that the echo travels there and back, so you will need to double the distance to the wall to find the distance travelled by the sound wave.
Alternative Method:
You could also try this without using an echo. One person ('A') with a stop watch stands a long distance away, typically 300-500 m from person ('B') who is going to bang wooden blocks together as described above. This time, person A starts the stop watch when they see the blocks being banged together, and stops the stop watch when they hear the sound less than a second later. Light travels much faster than sound, almost instantaneously in this experiment, so the delay is due to the slower speed of sound. If the distance is known as well as the time taken for the sound to travel from B to A, the speed can be calculated.
Questions:
4. A wall is 80 m away from some observers. A loud bang is produced by a drum, and an echo is heard 0.48 s later.
Using this data, calculate the speed of sound.
The sound wave travels there and back, so the distance is 160 m. The time taken is 0.48 s, so:
| speed = | distance |
| time |
| speed = | 160 |
| 0.48 |
speed of sound = 330 m/s ( to 2 sig. figs.)